Resource Monitoring
1. Introduction to Resource Monitoring
"Resource Monitoring" is a display panel of monitoring indicators in the monitoring center. It can provide a quick query of the current values, historical values, and comparison views of various indicators of each instance according to the product dimension. It can also set alarms to quickly bind alarm templates to various resources, realizing alarm notifications when thresholds are triggered, in order to quickly locate the cause of faults.
2. Basic Operations of Resource Monitoring
2.1 Resource List
In the resource monitoring list, basic monitoring data is displayed. The resource type to be viewed is determined by the resource type in the upper left corner of the page, and the selected resource type can be filtered through the filter box.
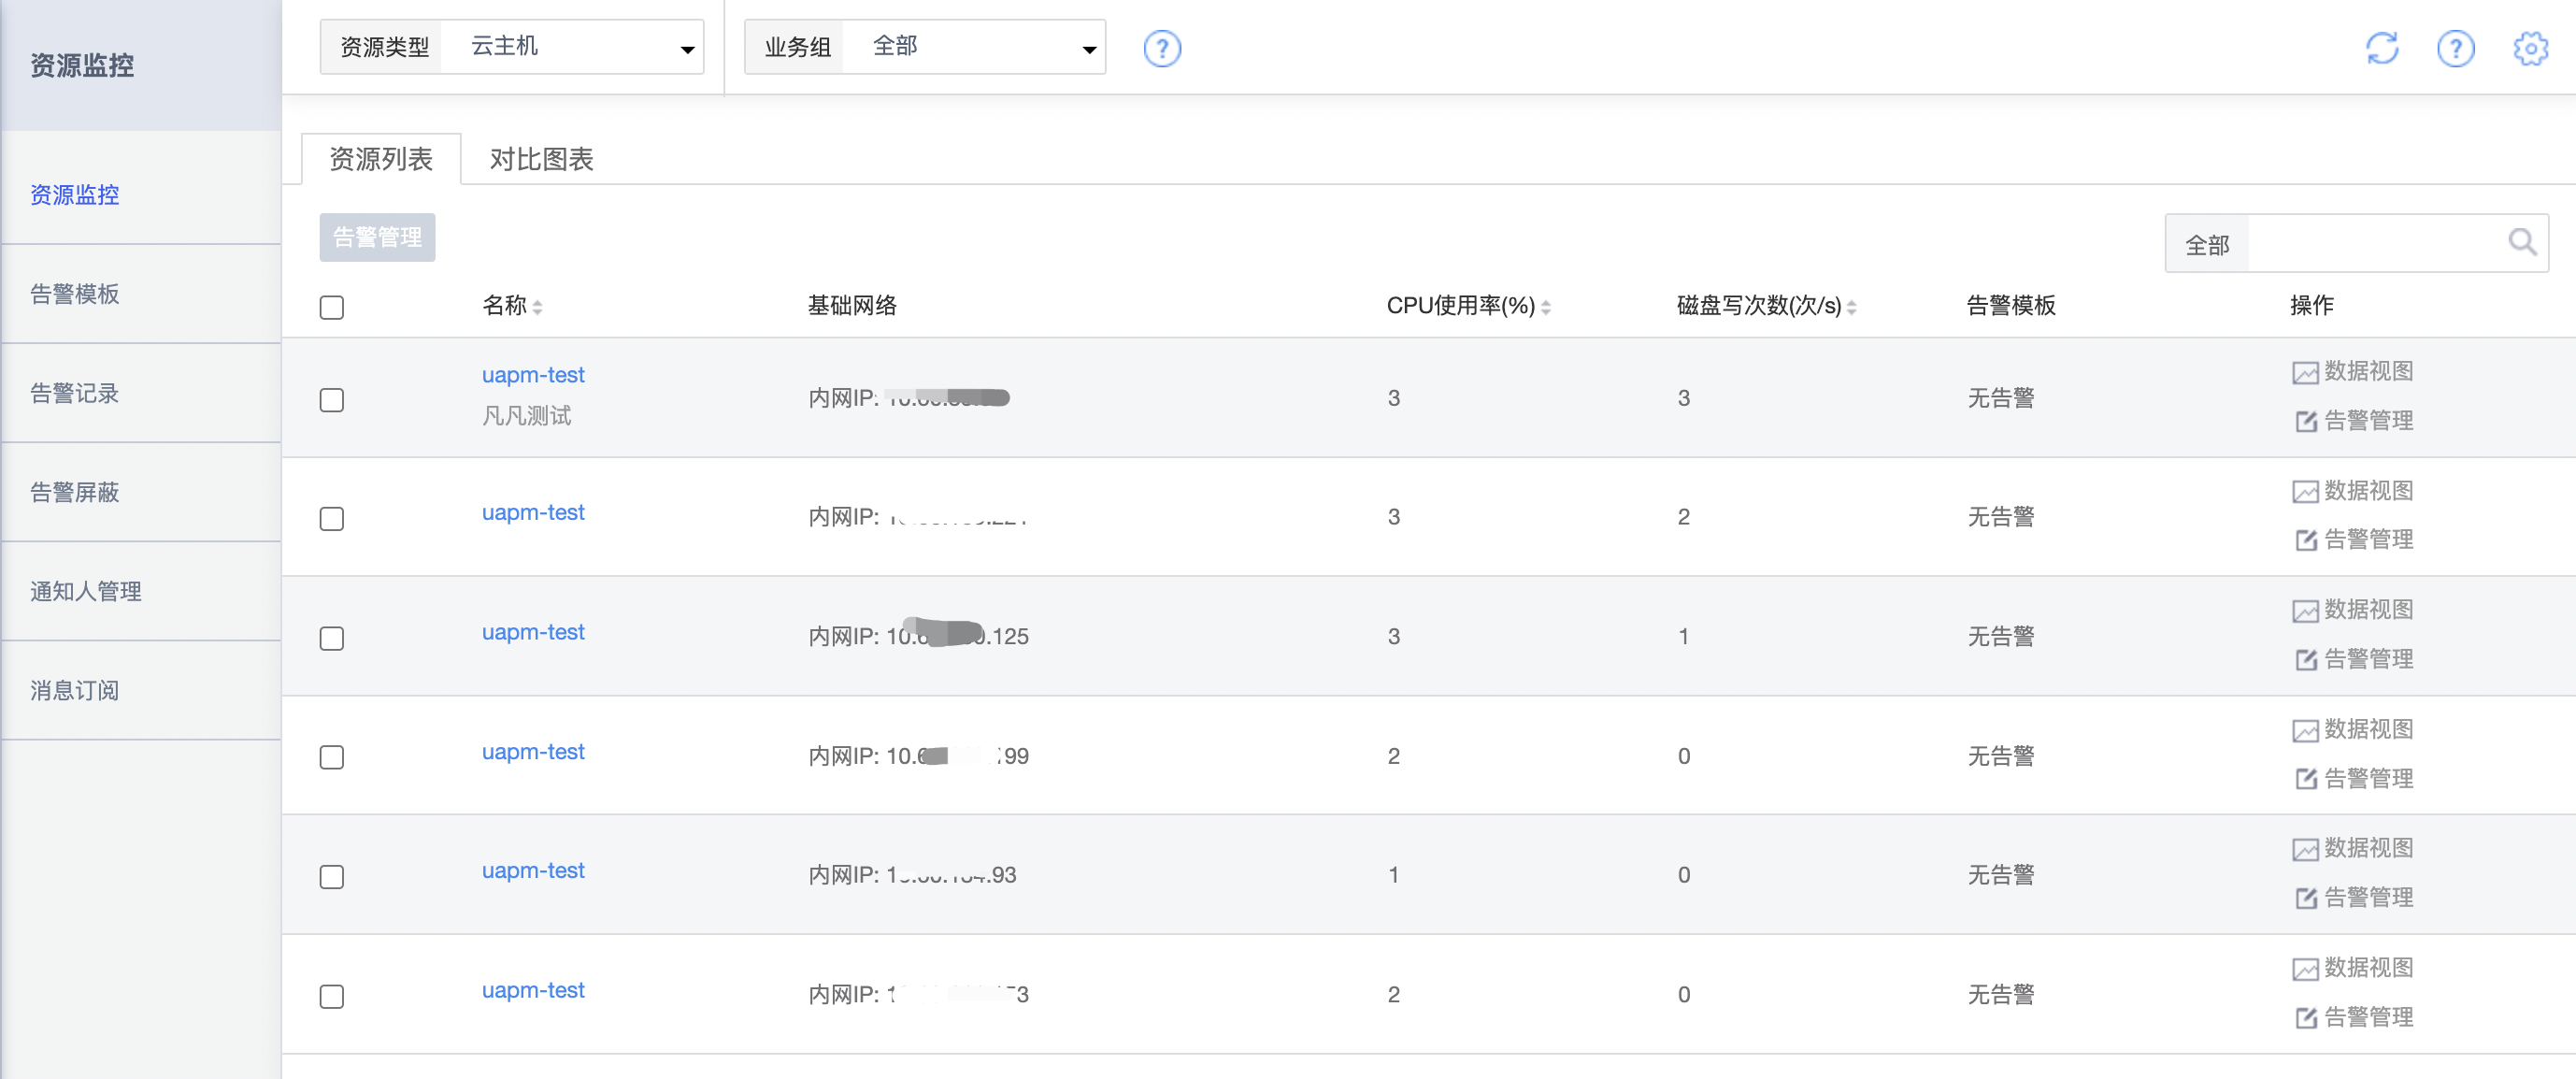
As shown in the figure above, the monitoring list of cloud hosts gives five monitoring indicators: "CPU usage rate", "Network card out/in bandwidth", and "Disk read/write throughput". Other monitoring indicators can be viewed by clicking the "Data View" button to enter the detailed icon page of resource monitoring.
2.2 Data View
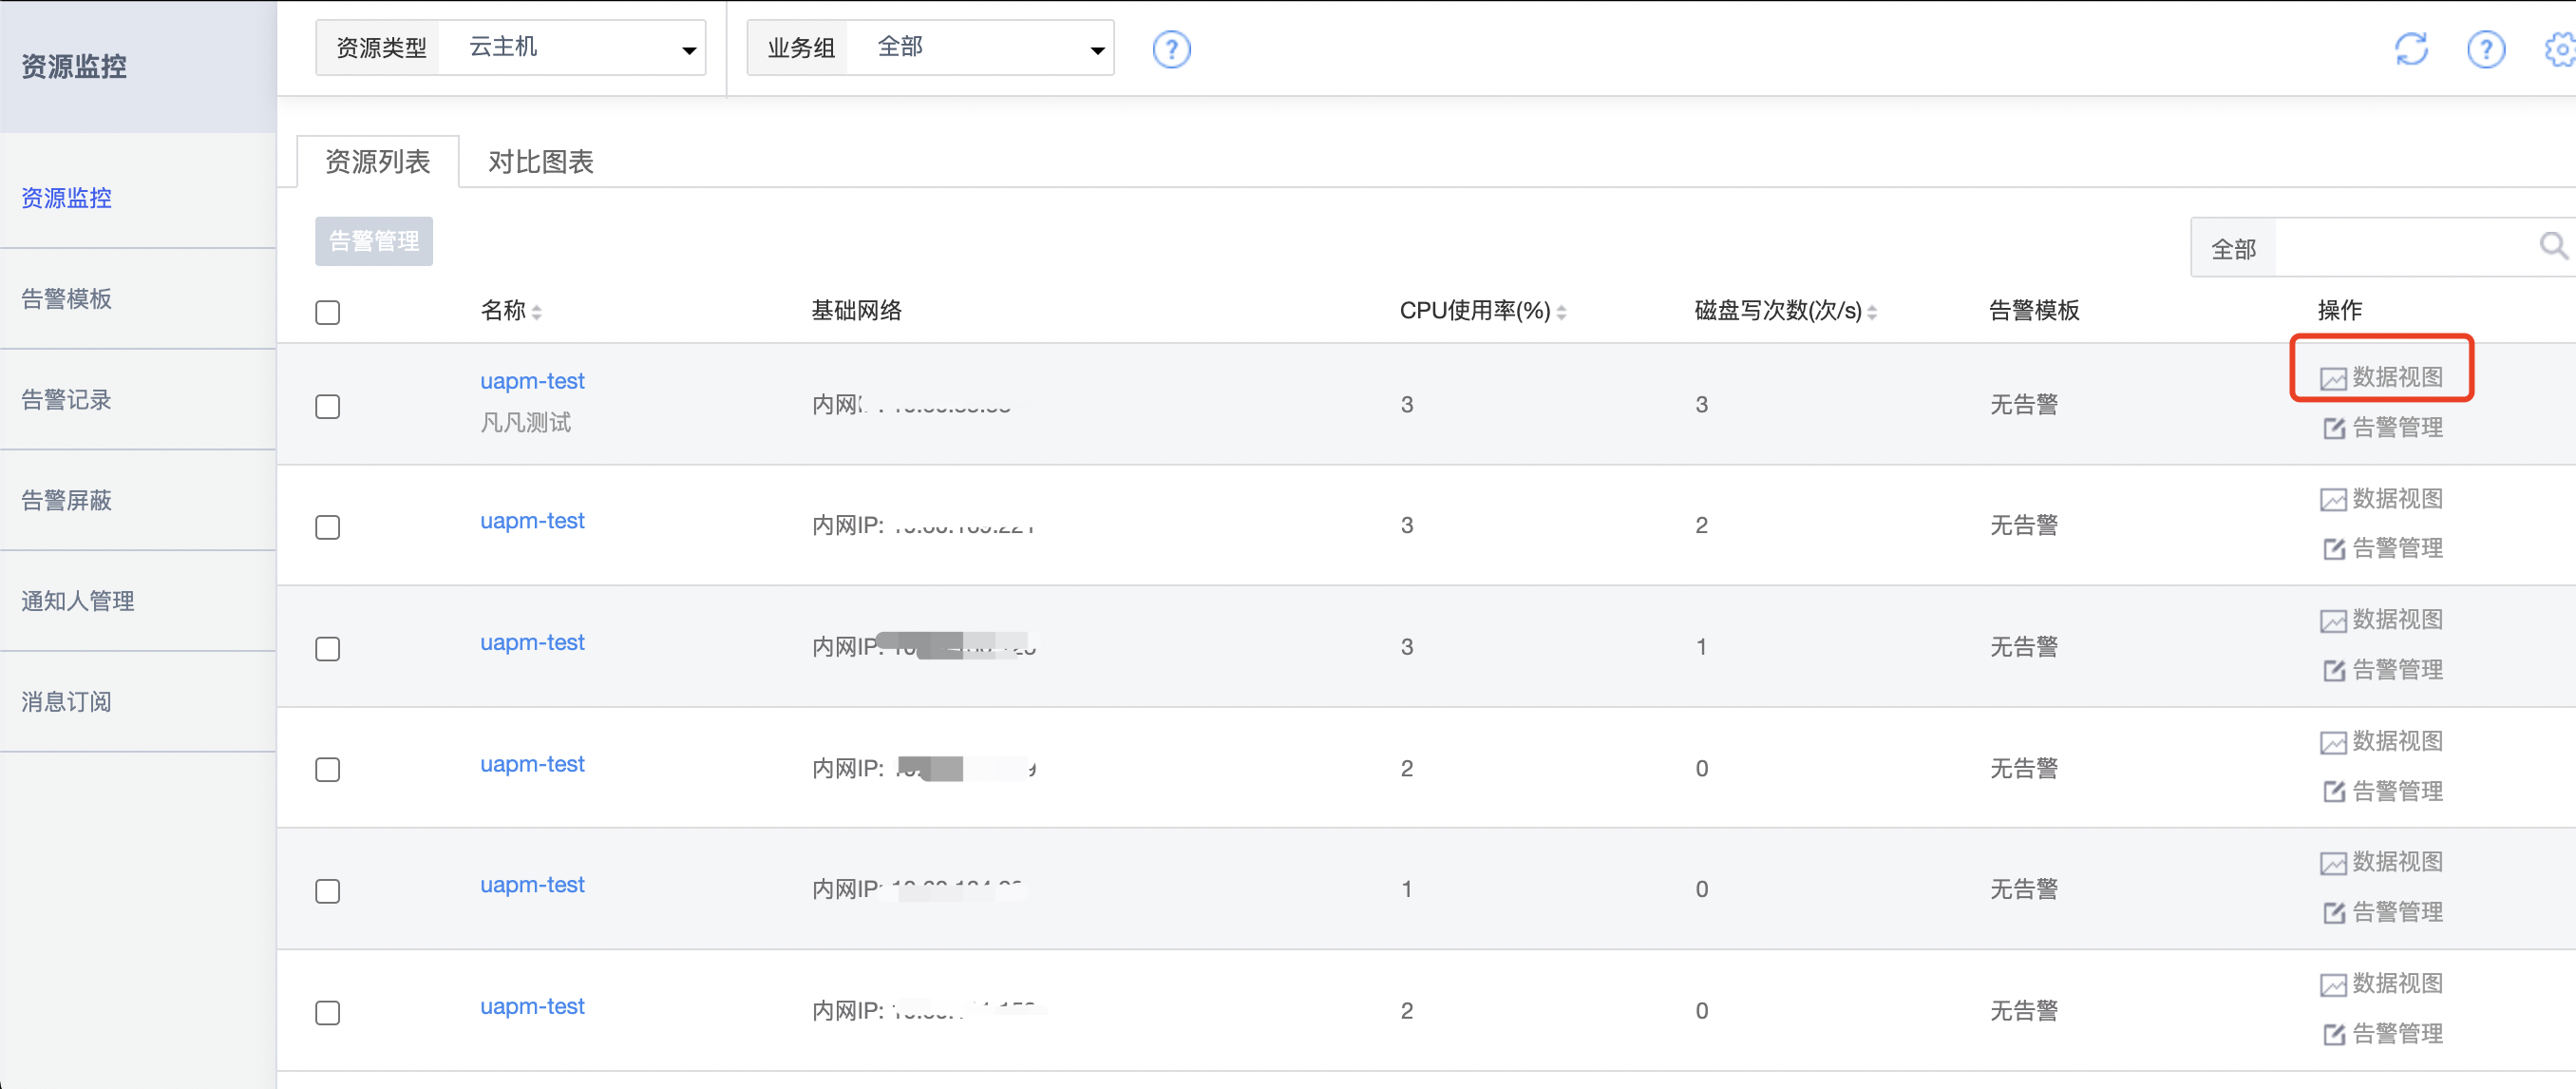
Click the "Data View" button in the resource list to enter the detailed data view page of the selected resource.
On the data view page, by default, the monitoring images of all monitoring indicators of the currently selected resource in the last 1 hour will be displayed, providing a quick view of the monitoring images of 1 hour, 6 hours, 12 hours, 1 day, 7 days, and 15 days. In addition, users can customize the time they choose according to their needs.
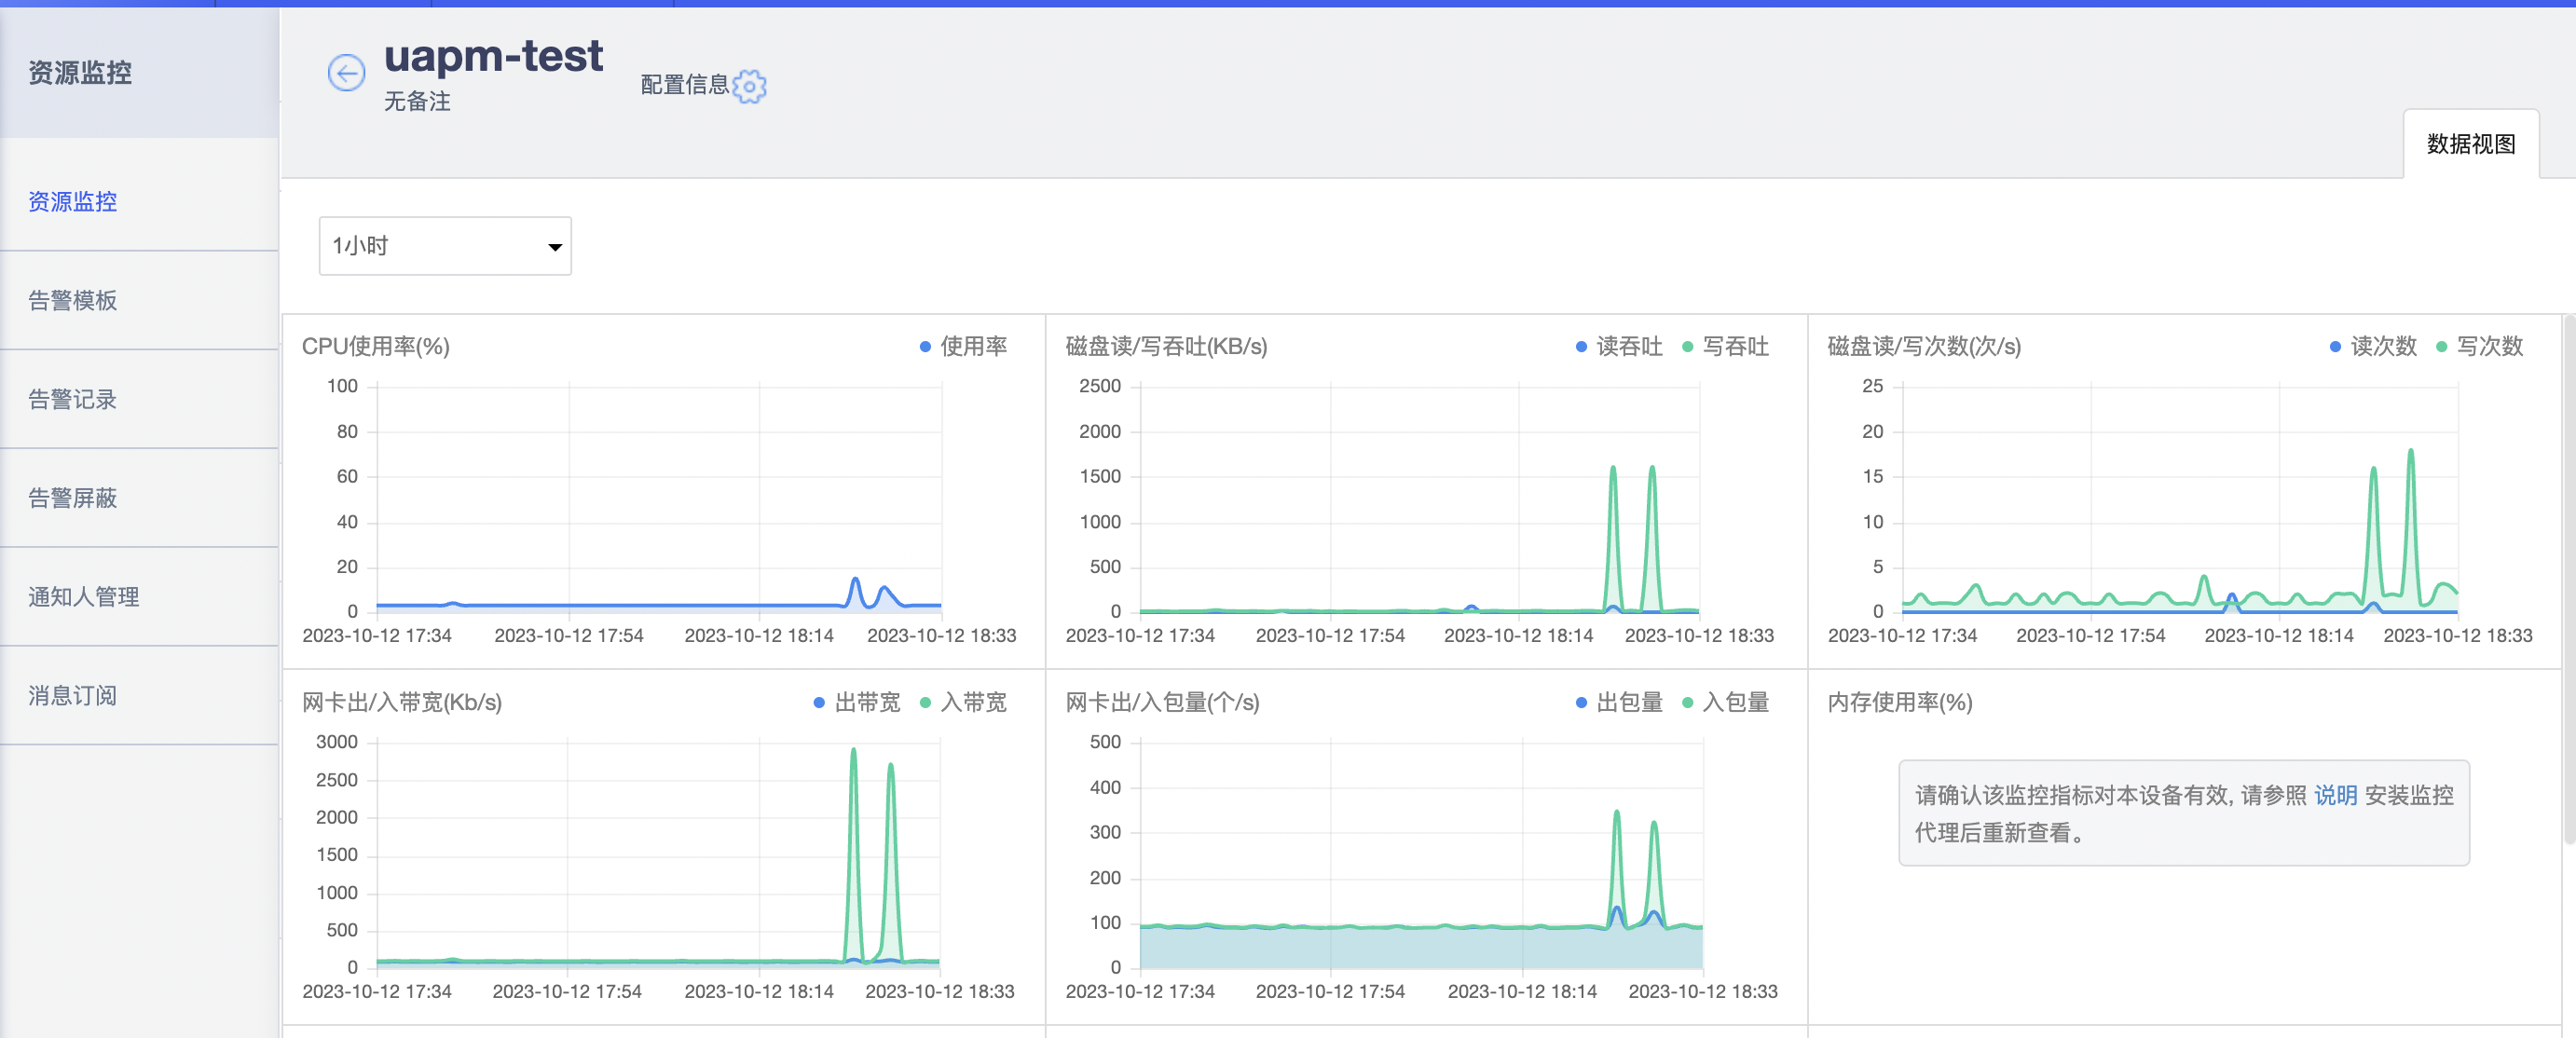
Note: The cloud host in the figure contains 16 monitoring indicators, some of which need to install monitoring agents to report data. If you need to install a monitoring agent for the cloud host, see Monitoring Agent.
2.3 Comparison Charts
In the resource monitoring page, in addition to the "Resource List" tab, there is also a "Comparison Chart" function for multiple resources, which is used to view the monitoring indicator views of multiple resources in a comparison way.
Click the "Comparison Chart" tab to enter, generate the comparison chart by selecting "Resources" and "Monitoring Indicators" two dimensions, and provide viewing options for different time periods.
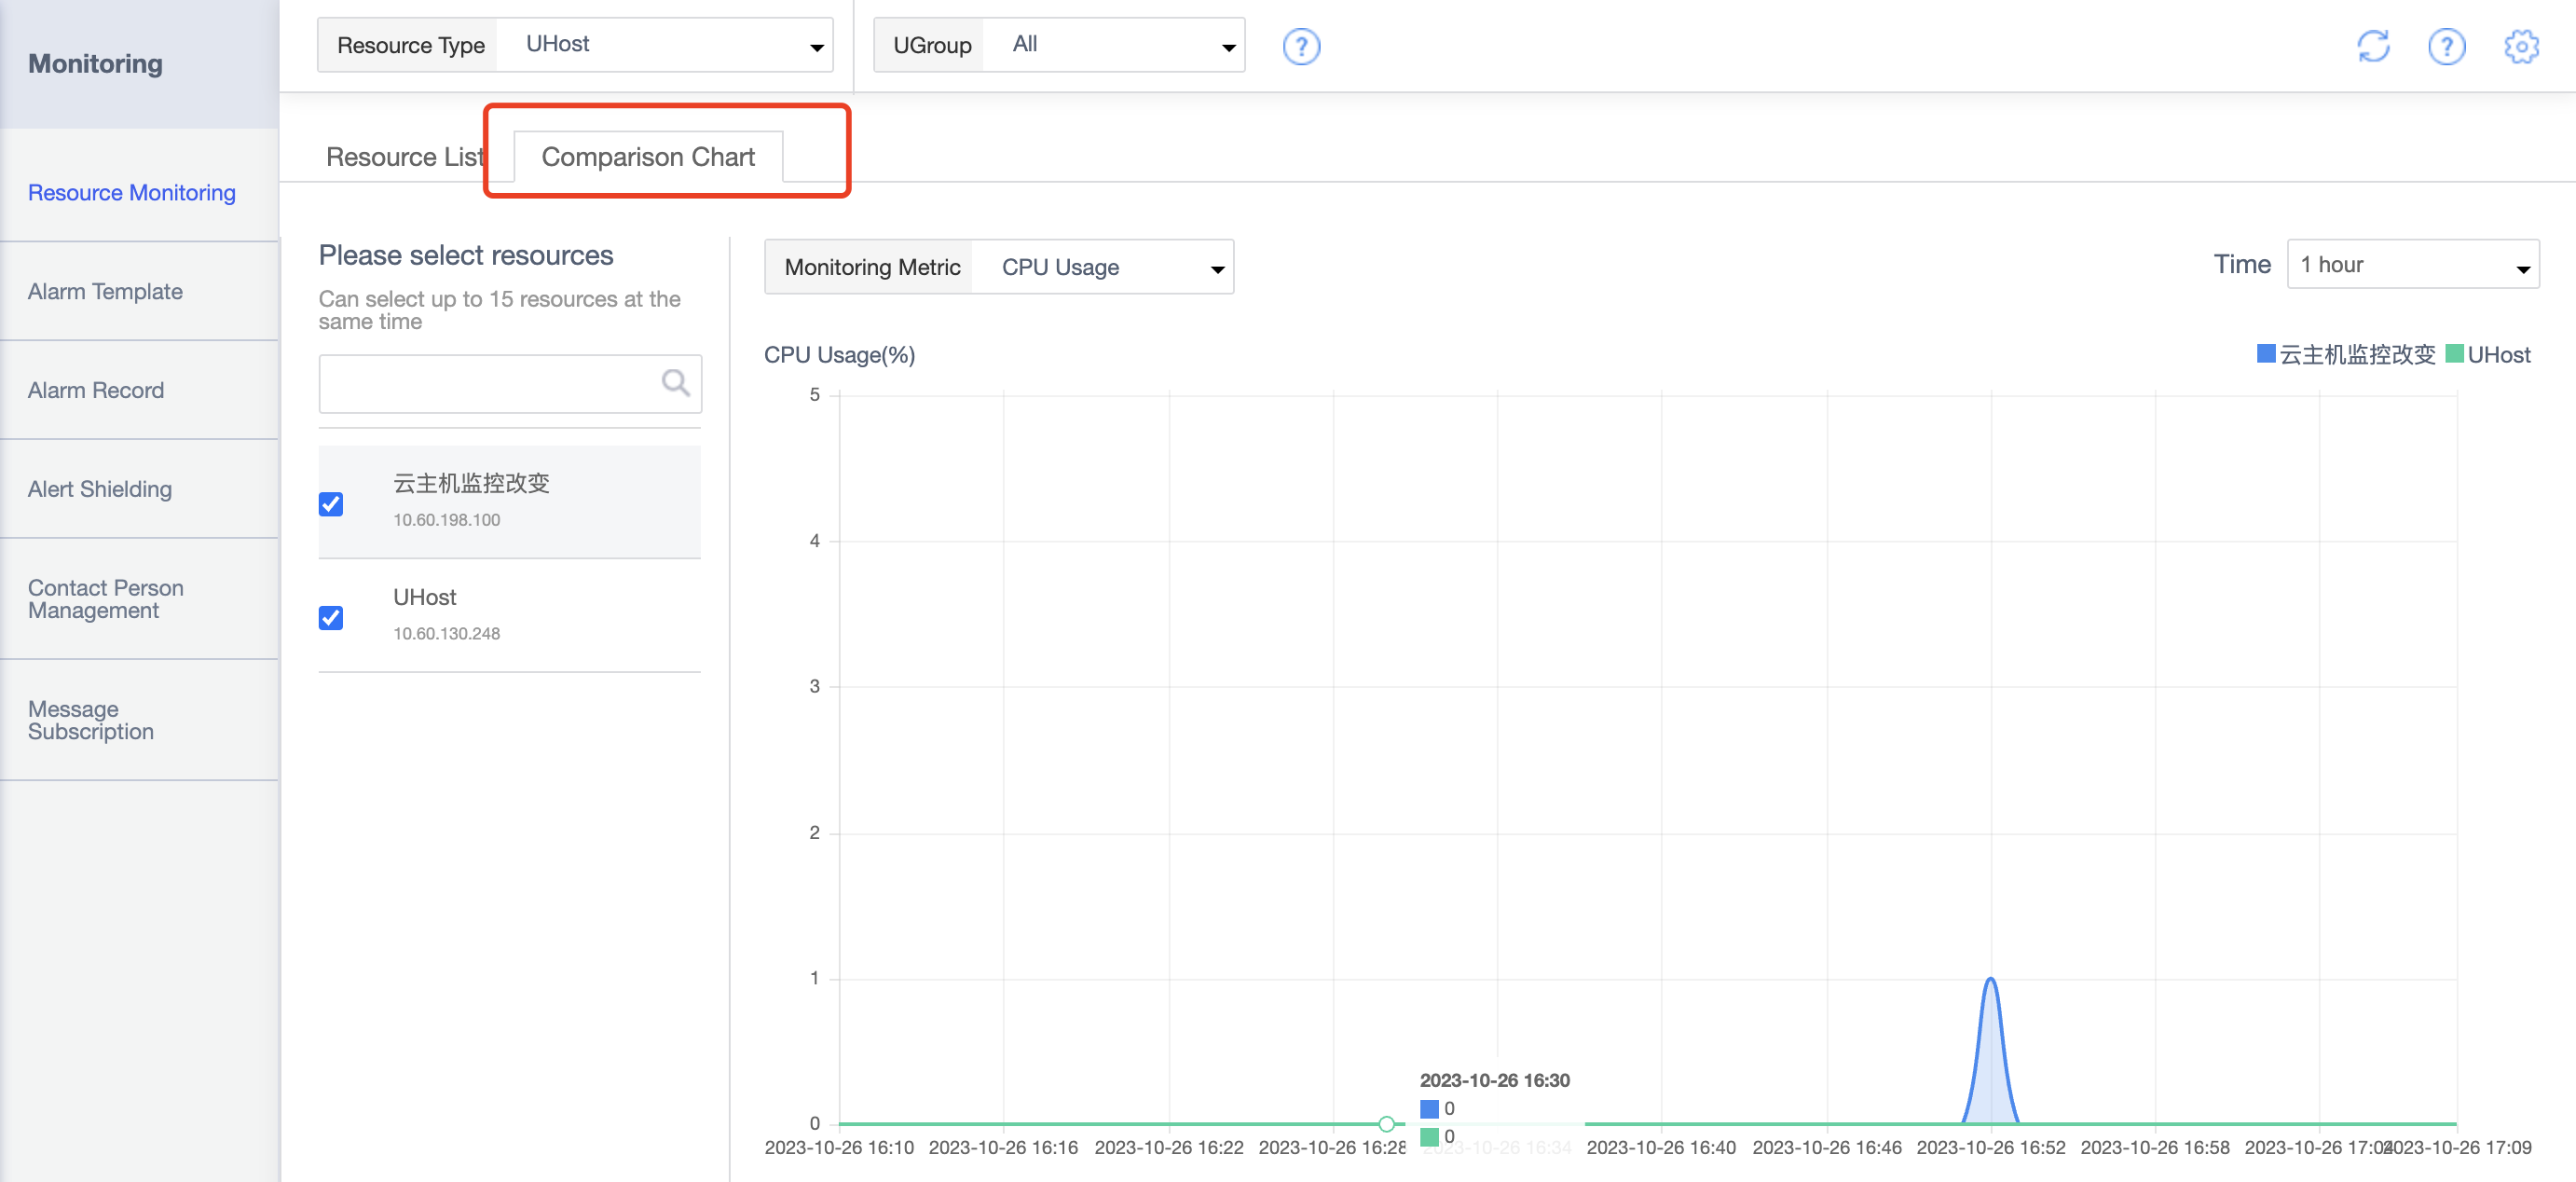
Note: At present, the comparison view supports up to 15 resource indicator comparison charts.
2.4 Setting Alarms
In addition to monitoring data and view viewing, resource monitoring provides a batch setting alarm function for resources, that is, "Setting Alarm Template".
Select resources and click "Set Alarm Template" to manage the alarm templates bound to resources.
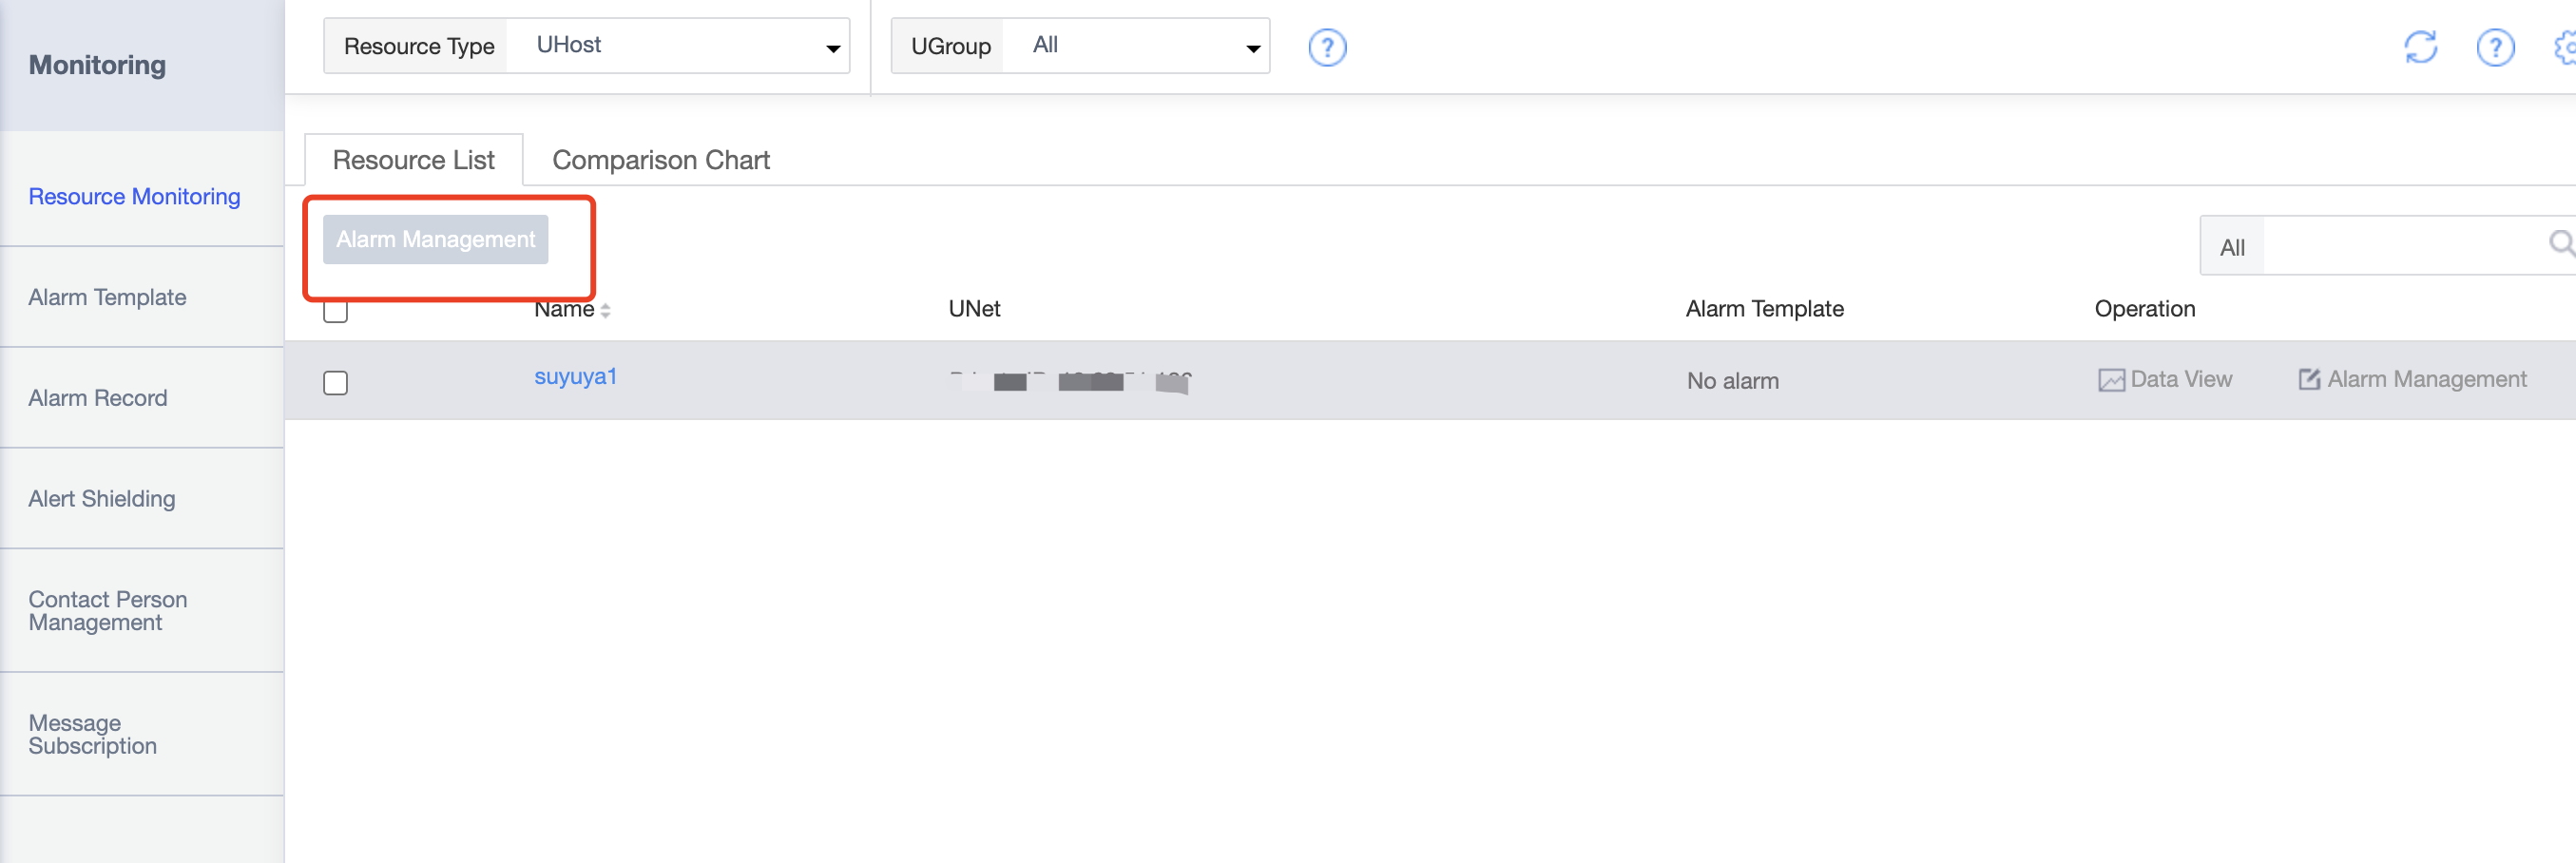
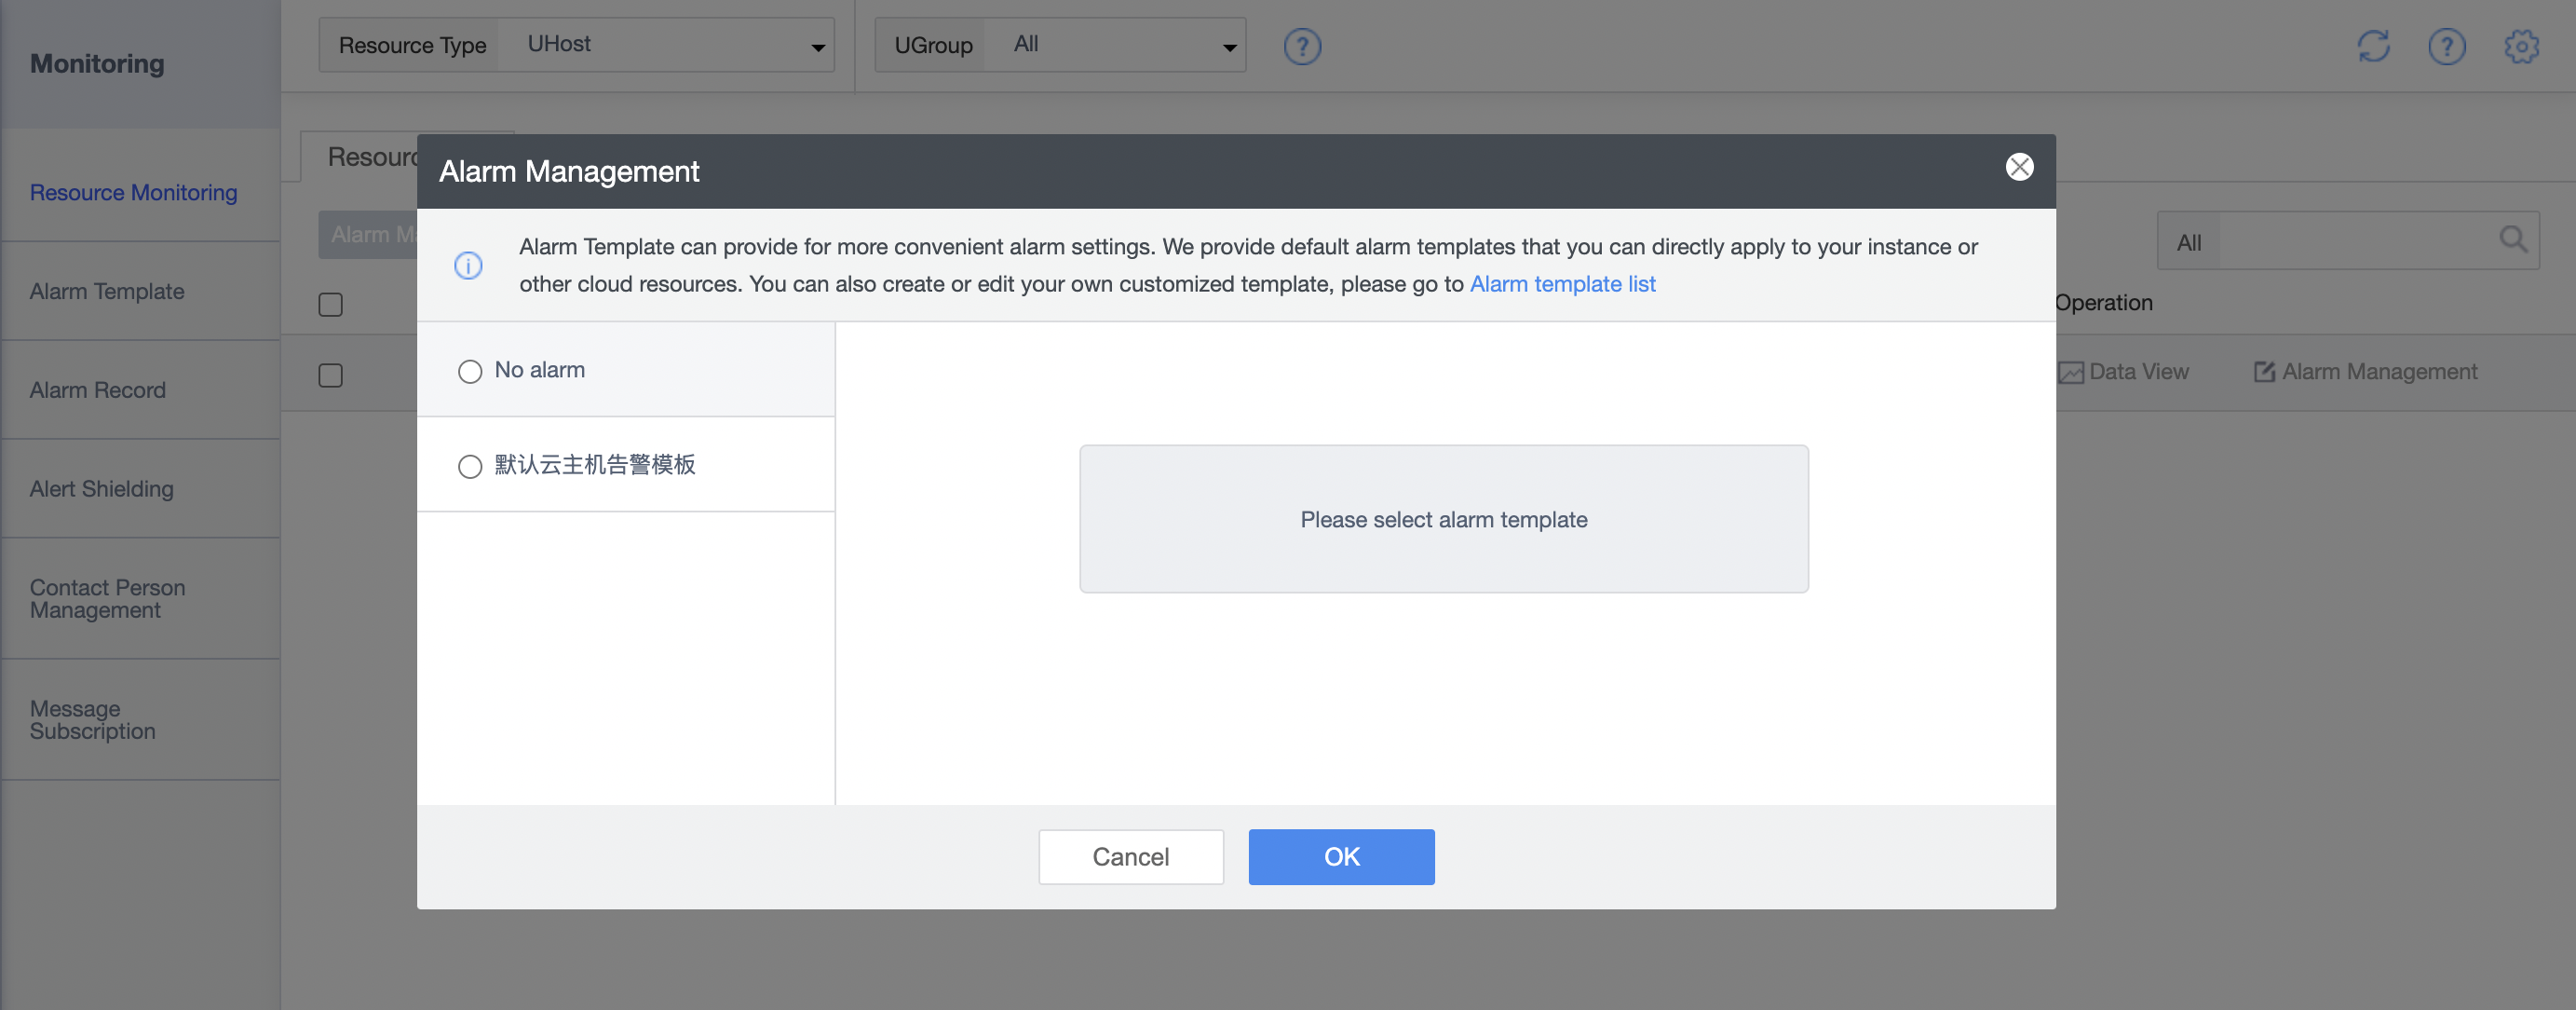
Note: The alarm setting uses the method of binding alarm templates. We provide default alarm templates for each resource. Users can create or copy new templates according to their needs to add custom monitoring thresholds.
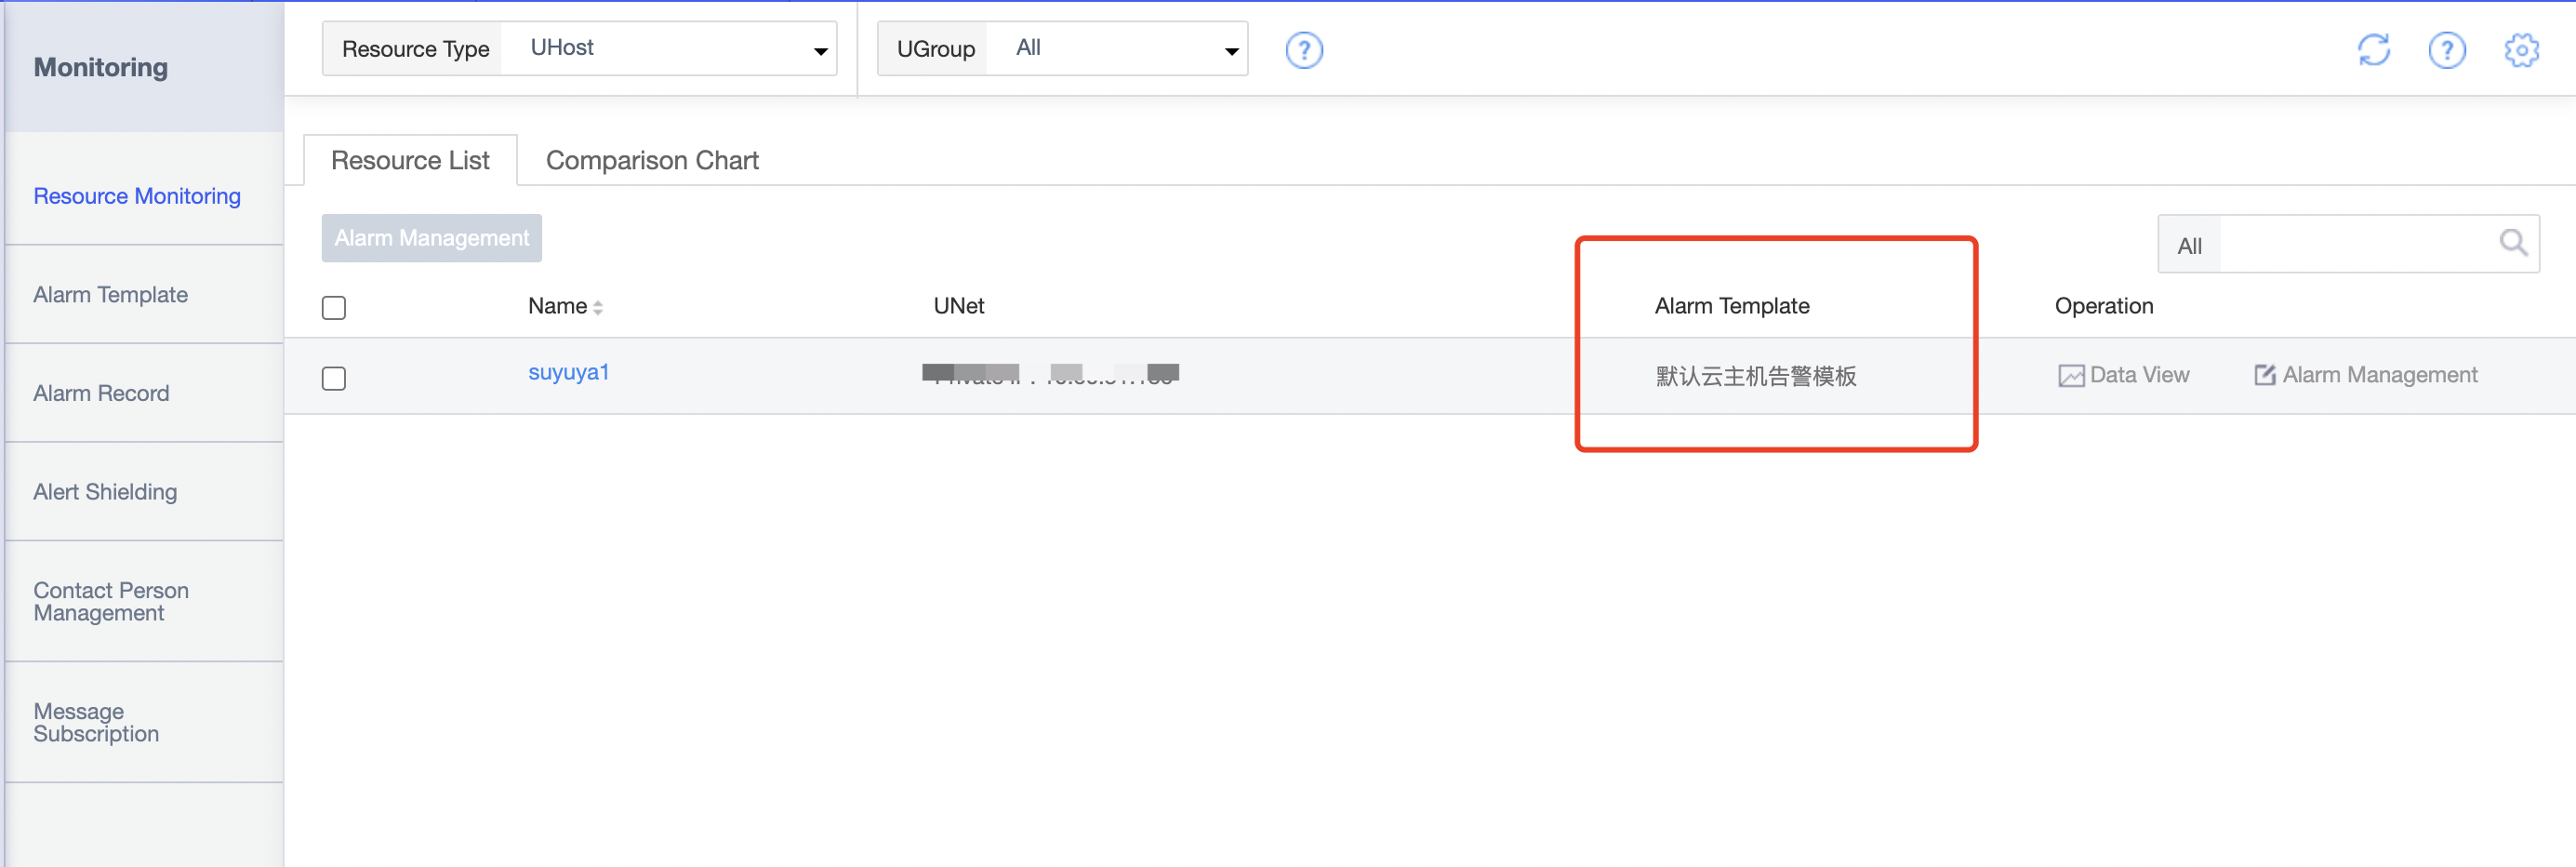
After setting, you can view the alarm template bound to the current resource in the resource list.
Note: For alarm template operations, see Alarm Template